


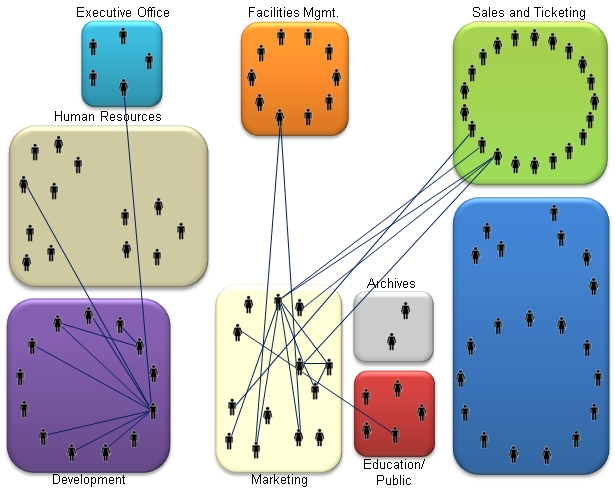
By mapping the actual patterns of communication and activity between people, we can see exactly where collaboration is taking place and where it is not. While insufficient collaboration is frequently a problem, too much collaboration can result in excessive meetings and discussions that get in the way of real progress. Network diagrams can help us identify both types of situations and provides us with a deeper understanding of how an organization REALLY functions.
Among the various network analysis tools that we use to evaluate collaboration within an organization, some of the most useful insights can be gleaned from a relatively simple table showing a high-level view of internal interactions. The table below summarizes the percentage of collaborative relationships both within and between organizational units out of a possible 100 percent in each cell.

In this hypothetical example, it might be determined that Divisions 3 and 4 have satisfactory levels of collaboration between them, while Divisions 1 and 7 do not. There could be a number of reasons for the limited collaborative activity between the latter pair. It may be that cultural barriers or office politics discourage people from seeking help outside their own division. Or, it could be that the people in one division do not know what the other division does and thus, do not know how to involve it in projects. This type of information can be considerably useful for managers in helping them to identify areas where collaboration is not occurring so that they can target improvements with precision.